NEXTGEN 
Above the market insights in 4 clicks
What is the MappingApp about?
When working with different categories and markets it all comes down to data consistency, business relevancy, and quick and easy accessibility to your consolidated data. And this is what the MappingApp is all about: a quick, easy, and reliable app to get above the market insights.
How often do you wonder?


How can I aggregate different markets and categories and visualize it in a fast and simple way?
Is there a way to optimize the creation and maintenance of our data model?
I need the data classified in the same way as how we look at it internally. How can I achieve this without the need for coding?
How can I keep up with data and business’ requirement changes in a more efficient way?
How can I combine data coming from different data providers?
I need to improve part of our data processing flow, but don’t want to start everything from scratch, is this possible?
Our Solution
When using NextGen MappingApp you’ll be able to:

Consolidate your data
Put together datasets from different markets and/or categories, despite them having different periodicity, currency, and language.
Most importantly, consolidate data from different providers.

Harmonize your data
Doing this in an optimized way across markets and categories will save you and your team time, while improving data quality and insights.

Enhance synergy across teams
The MappingApp provides a collaborative environment with a communication platform which notifies end users, data analysts, and IT about required changes and adjustments with easy follow up features.

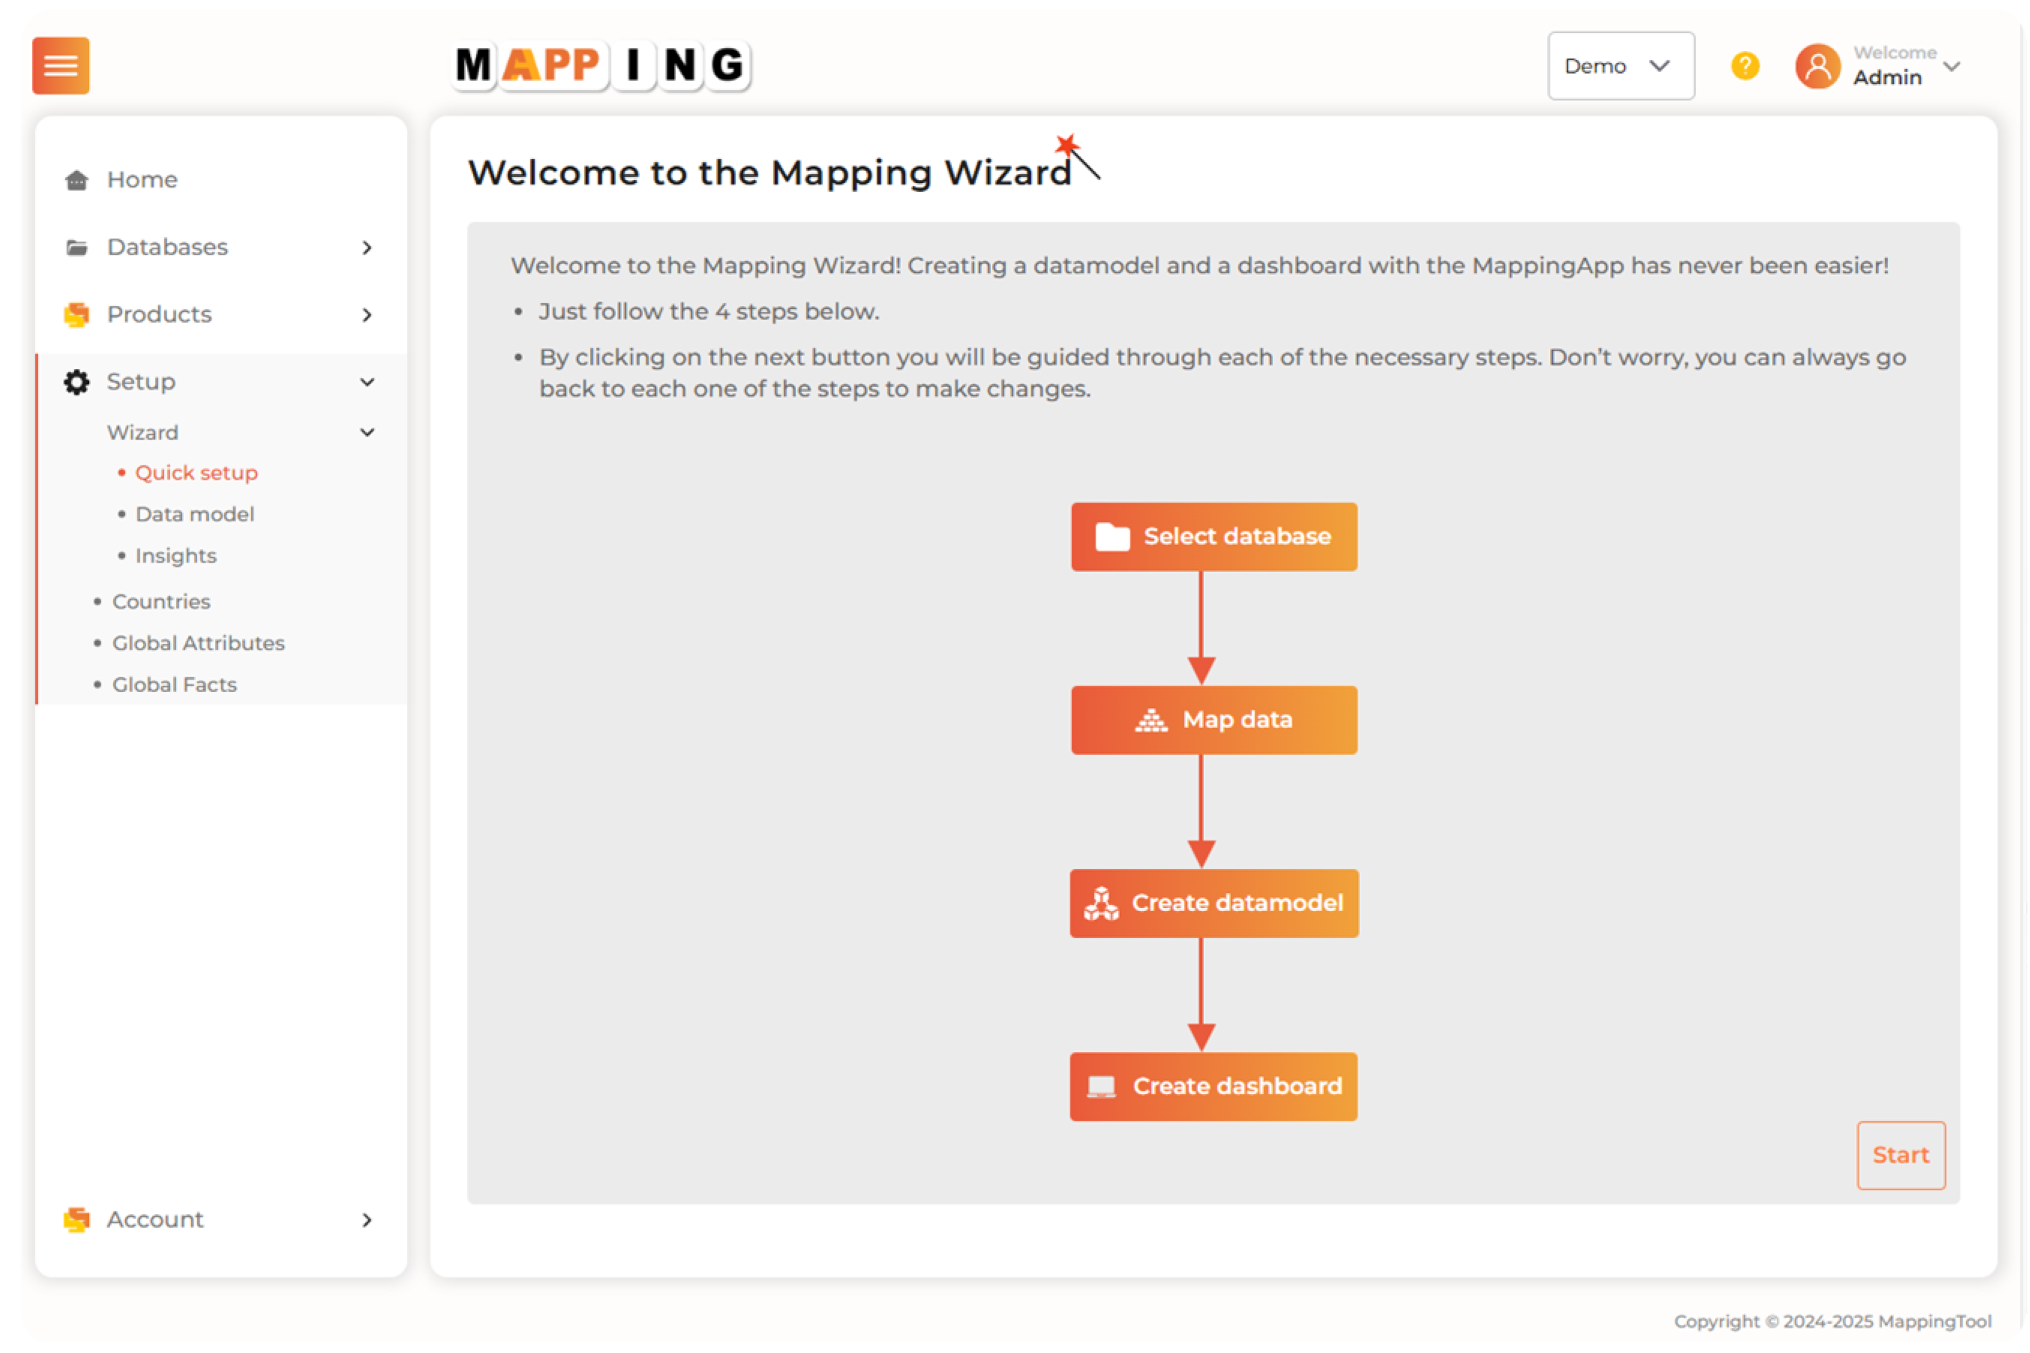
Have a data model and visualization in 4 clicks
The MappingApp allows you to immediately start analysing your data and getting great insights by removing the tedious work it takes to set everything up.
How users benefit from the NextGen MappingApp

From raw data to insights in 4 clicks
Easy to create algorithms to classify existing and new data
AI integration to enrich data with additional attributes
Easy to use and learn
Different stakeholders can contribute to a better output for everyone
Consolidate different data sources in the same data model
Easily scalable
Save time and resources
Automate repetitive ETL tasks
Transparency, accountability and control over final output
Once upon a time...
A leading multinational brand was working with NielsenIQ and IRI/Circana sales data across dozens of markets and categories.
Every country delivered flat files in varying formats, languages, currencies, and time periods. Some files had masked (private label) sales, while others lacked key product characteristics altogether.
Trying to bring all this together for a global sales performance view? A nightmare. Each regional team had its own way of working with data, and stitching together a global story meant weeks of manual effort, inconsistent outputs, and constant firefighting. Leadership wanted clarity and speed.
The data team needed structure, automation, and control.
That’s when they found the MappingApp.